LevelForecast support is here to help. Learn more about popular topics and find resources that will help you with all of your LevelForecast products.
LevelForecast is a unique technical analysis system that allows you to simulate price (Price Level) and time levels (Time Level) into the future, based on this system the LevelForecast indicator was developed.
The construction of Price Levels (Price Level) is based on algorithms for searching extremes on senior (Daily, Weekly) timeframes in the entire history of the instrument. The construction of the Time Levels is based on algorithms for the search for patterns and cyclicality between extremes on senior (Daily, Weekly) timeframes. Based on the obtained results, Price and Time Levels are built, one of the features of the indicator is the ability to project calculated price levels according to a given algorithm into the predicted range.
Copy dowloaded indicator file to the Indicators folder of your terminal MT4/MT5 via OS functions drag-and-drop or please reading step-by-step documentations page or watch the video (trading algorithm, installation and configuration of the indicator)
The letter you received contains information about your personal key (UserKey) and the latest version of the LevelForecast indicator as an attached file with the ex4 extension, as well as links to documentation and video on installing and configuring the indicator in the MT4 trading platform.
Tip: You need to save the attached file with the ex4 extension (the saved file will often be placed after saving in the Downloads folder) and then copy the file with the LevelForecast indicator to the Indicators folder of the MT4 terminal according to the documentation. The indicator is copied using OS functions, drag-and-drop, or by dragging and dropping a file from one folder to another.
The LevelForecast indicator builds Base price levels, they are highlighted on the chart and are indicated by the symbol B, the base price levels can be either blue or green, the color of the base price level (horizontal line) depends on the trend trend and its estimated state. The priority of levels can be conventionally distinguished in such a hierarchy - from basic level B to derived levels D, H4, H1, M30, etc ...
It is also important to take into account the fact that each level has its own strength, often the price will be, tends to the next price level (from level to level) in order to find support / resistance, extremum or consolidation there.
Price levels are calculated and rebuilt constantly, price behavior on higher timeframes and calculation algorithms can rebuild the price level at any time.
- update the MT4/MT5 terminal to the latest version - this can be done by downloading the latest version from the official website
- if you have an antivirus installed, check the antivirus settings for blocking the MT4 program.
- check access to the site levelforecast.com from the Internet Explorer browser, if access is absent or limited, you need to check the network settings of the Internet Explorer browser.
The LevelForecast indicator must be opened using the MT4 trading terminal (MetaTrader 4)
Tip: You need to save the attached levelForecast.ex4 file (the saved file will often be placed in the Downloads / Downloads folder) and then copy the levelForecast.ex4 file (LevelForecast indicator) to the Indicators folder of the MT4 terminal according to the documentation.
The indicator is copied in the Windows operating system using OS functions, drag-and-drop, or by dragging and dropping a file from one folder to another.
The version of the LevelForecast indicator is designed for the MT4/MT5 trading platform.
Apparently, the MT4/MT5 terminal cannot get the calculated data for building models from the LevelForecas cloud. possible solutions:
- if you have an antivirus installed, please check the settings for blocking the MT4/MT5 programs.
- check access to the site levelforecast.com from the Internet Explorer browser; if access is absent or limited, you need to check the network settings or the settings of the Proxy server in the Internet Explorer browser.
- try updating the MT4/MT5 terminal to the latest version - this can be done by downloading the latest MT4/MT5 terminal version from your broker's or Metaquotes website.
LevelForecast is a comprehensive system of technical analysis. System LevelForecast allows you to build a model of price and time levels in the forecast range. On the created algorithms and basic principles of the LevelForecast system, a technical analysis indicator for the Metatrader4 trading platform was developed. The indicator is adapted for the desktop version of the trading platform and is developed in the MQL4 programming language.
At the heart of the modeling of Price and Time levels, algorithms are used to search for mathematical regularity and cyclicity between extremes for significant price and time intervals for the entire history of the instrument. The obtained results allow to build in the automatic mode a calculation model in the form of base and derived levels of price and time in the predicted range.
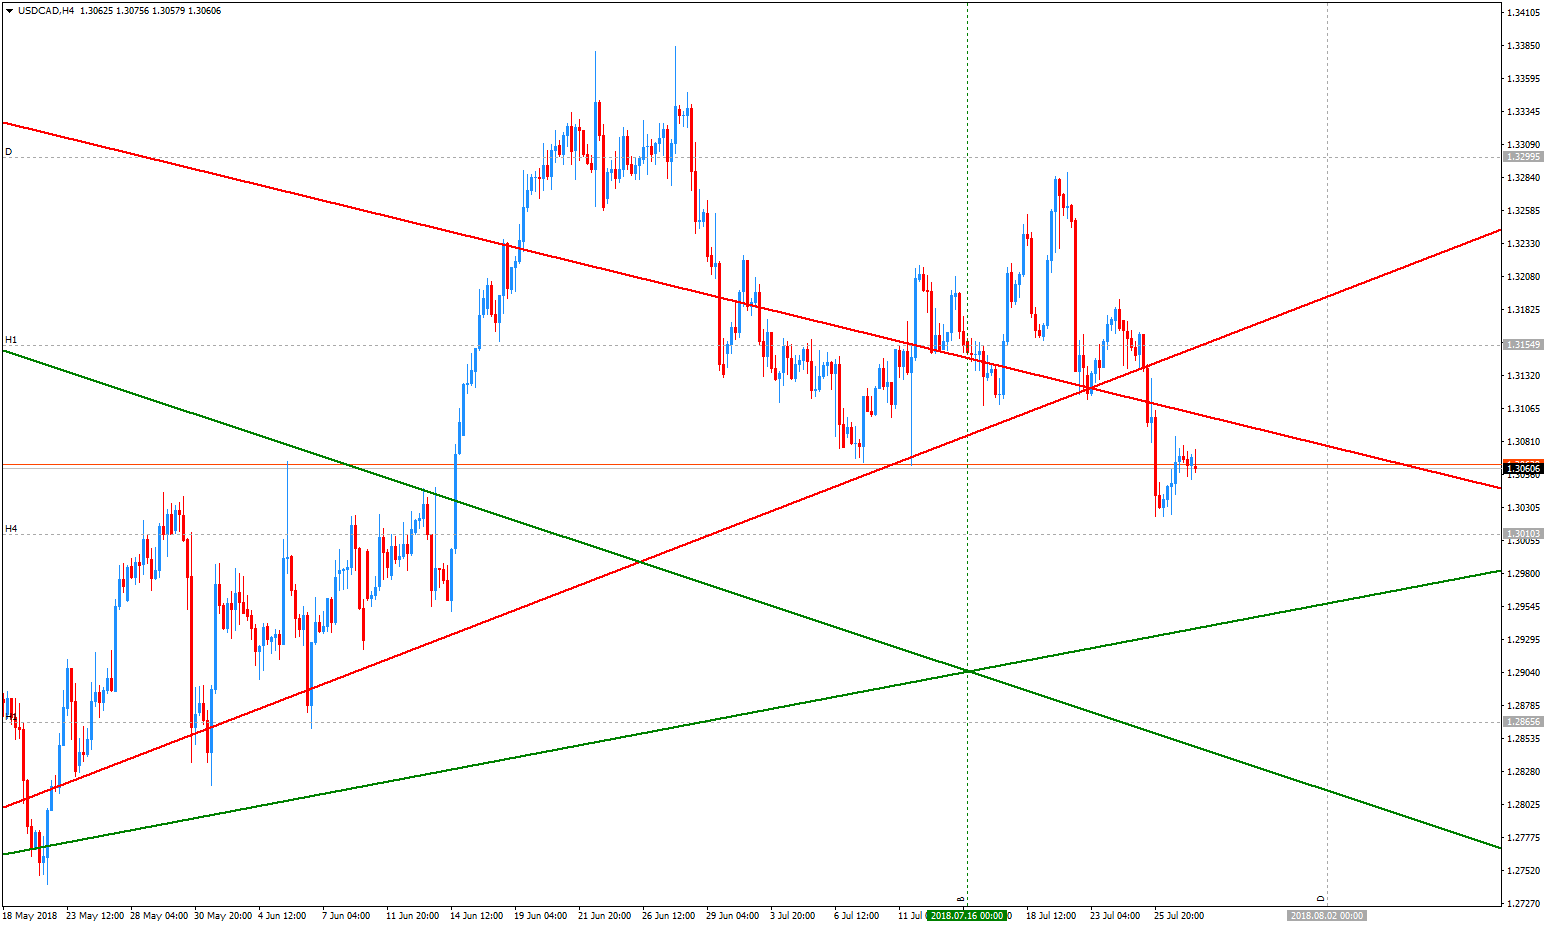
Base price levels Base Levels, on the chart are displayed by the symbol B and are constructed in the form of horizontal lines. The derivative price levels Derivatives Price Levels (D, H4, H1, M30, M15, M5, M1) are based on the constructed nearby Base price levels. The constructed levels are located on the terminal chart according to the applied price modeling algorithms. The price levels on the terminal chart are presented in a strict hierarchy, depending on the strength and significance of the levels. Naming levels can be conditionally separated in this hierarchy - from the base level B to the derived levels D, H4, H1, M30, M15, M5, M1.
Time Levels indicate a possible price reaction in a range of levels or abnormal price movements above the standard ATR value. In the chart, the time levels are displayed with the symbol B and are constructed as vertical lines. According to the applied time-level modeling algorithms, the Derivatives Time Levels (D, H4) Derived Time Levels can be presented and visualized on the chart, which have their strength and significance and are based on the constructed nearby Base time levels.
Please make sure that you have successfully downloaded the file with the indicator LevelForecast.ex4, the indicator file will often be located in the Downloads folder.
Tip: You can download the LevelForecast indicator on the LevelForecast page in the Personal Office.
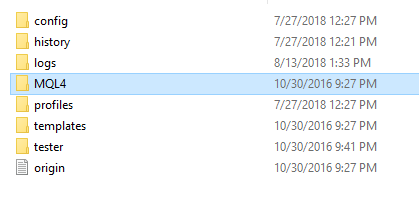
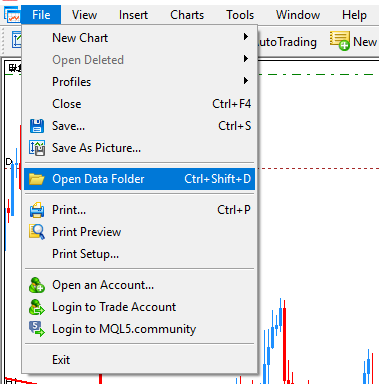
1. In the of MT4 terminal of main menu bar select the menu item File, then select the menu item Open the Data Folder.
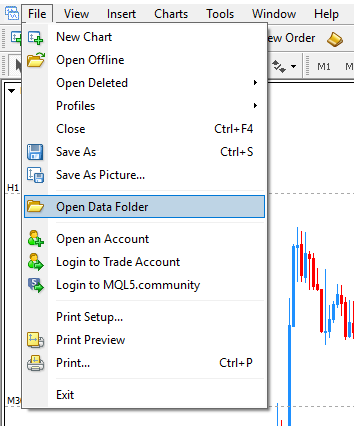
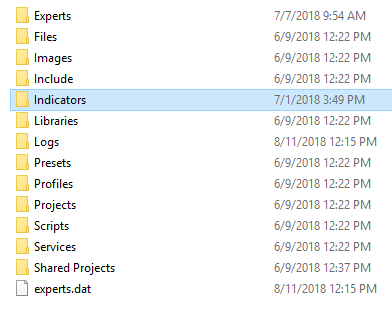
2. In the opened window of the data directory, go to the MQL4 folder
3. Next, go to the Indicators folder and copy the file with the indicator LevelForecast.ex4, then return to the terminal MT4.
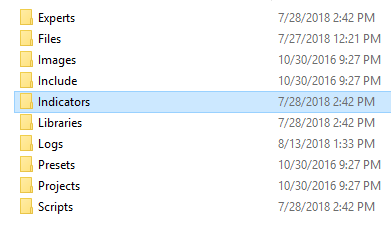
Tip: You can create a separate folder for the LevelForecast indicator or copy the file directly to the Indicators folder.
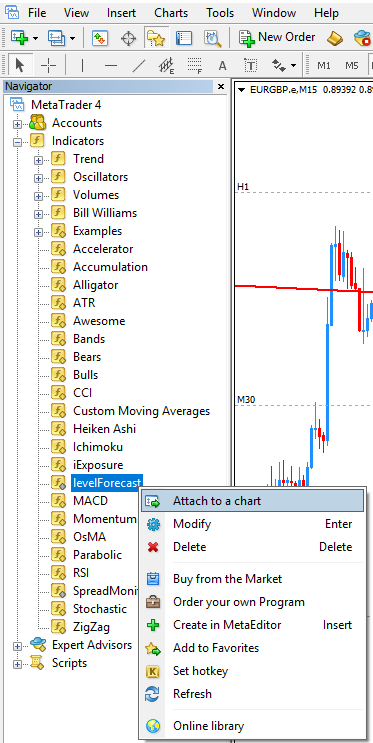
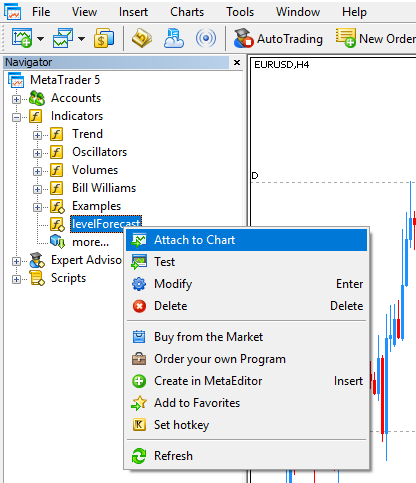
1. On the main menu bar, please select the menu item View, then select the menu item Navigator. In the appeared window of the tree structure, select the menu item Indicators and in the list of indicators we find the line with the name of the indicator LevelForecast. After that, drag the indicator onto the chart by drag-and-drop method or on the line of selecting the LevelForecast indicator, select the menu item Attach to Chart.
Note: If the indicator does not appear in the selection list in the Navigator panel, you need to do this by selecting Refresh from the Navigator panel.
2. In the window that appears, on the Input Parameters tab, you can check or change the parameters of the indicator.
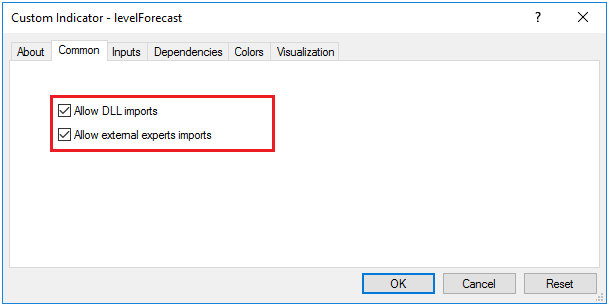
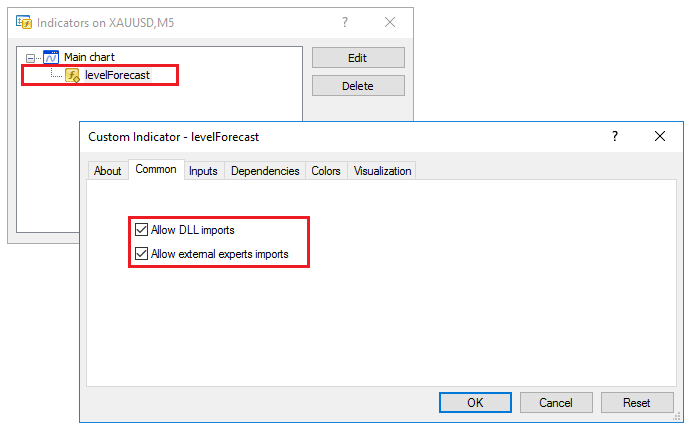
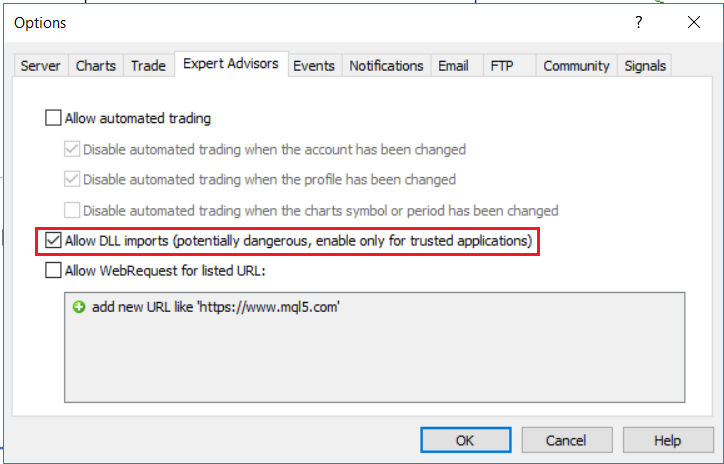
3. Important: for the work properly of the LeverForecast indicator, you need to check and set the DLL import option. To do this, go to the "General" tab
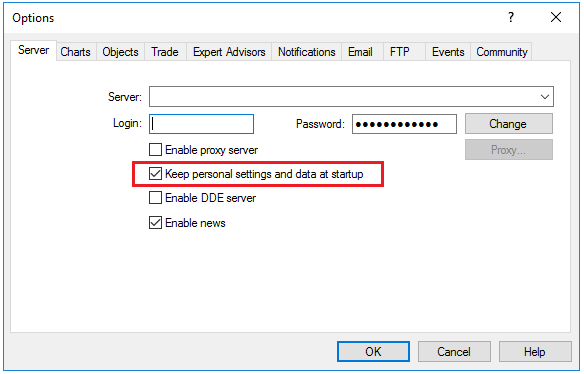
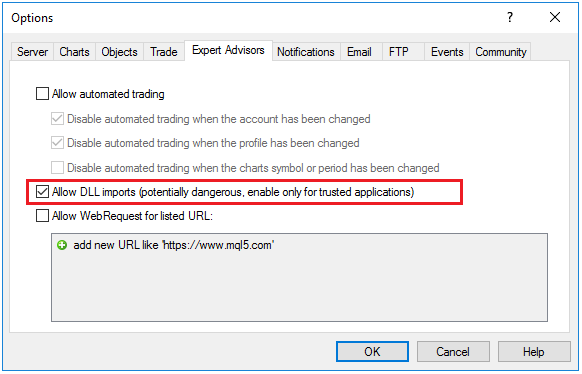
and also check the "Allow DLL import" settings in the Main menu of the "Tools" - "Settings" tab - the "Expert Advisors" tab.
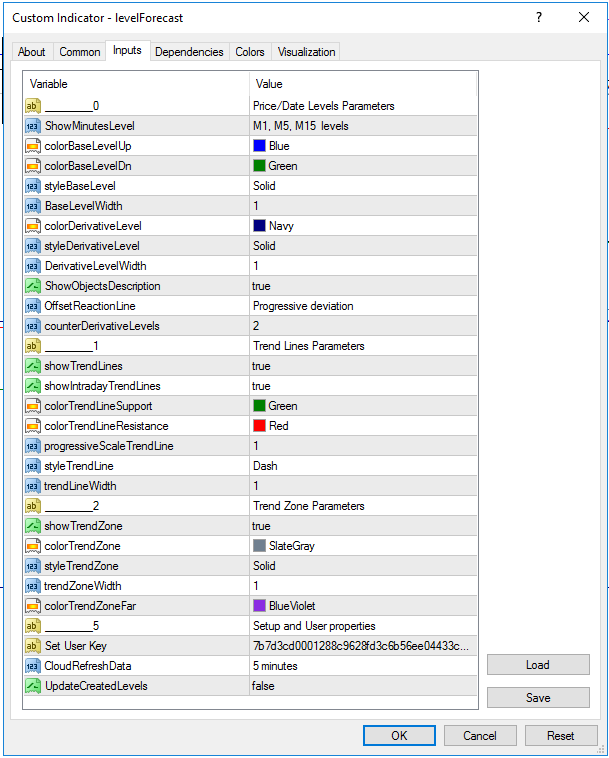
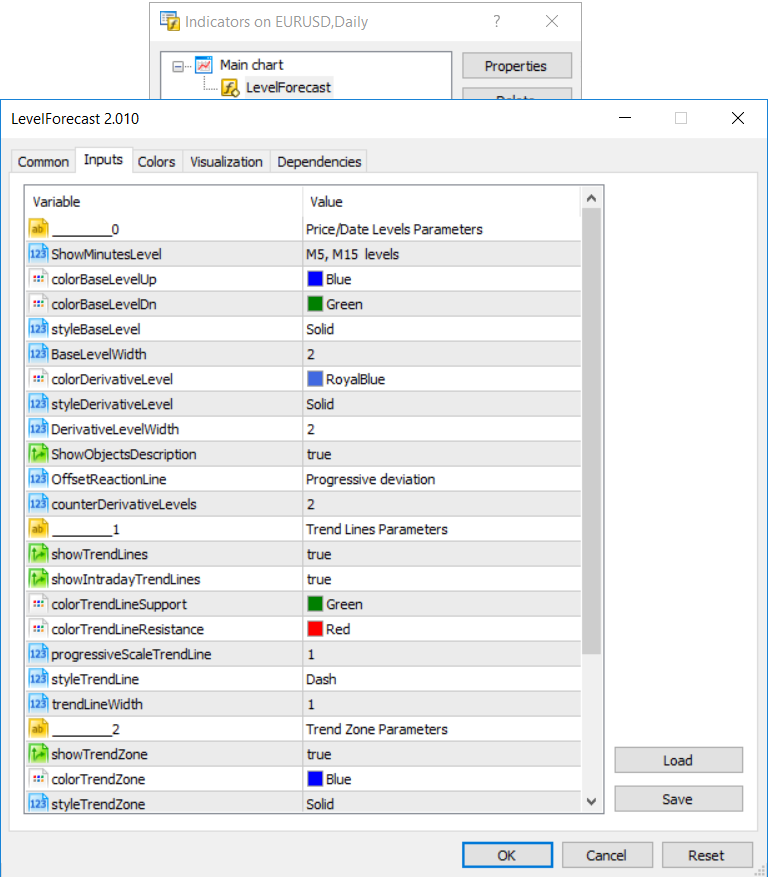
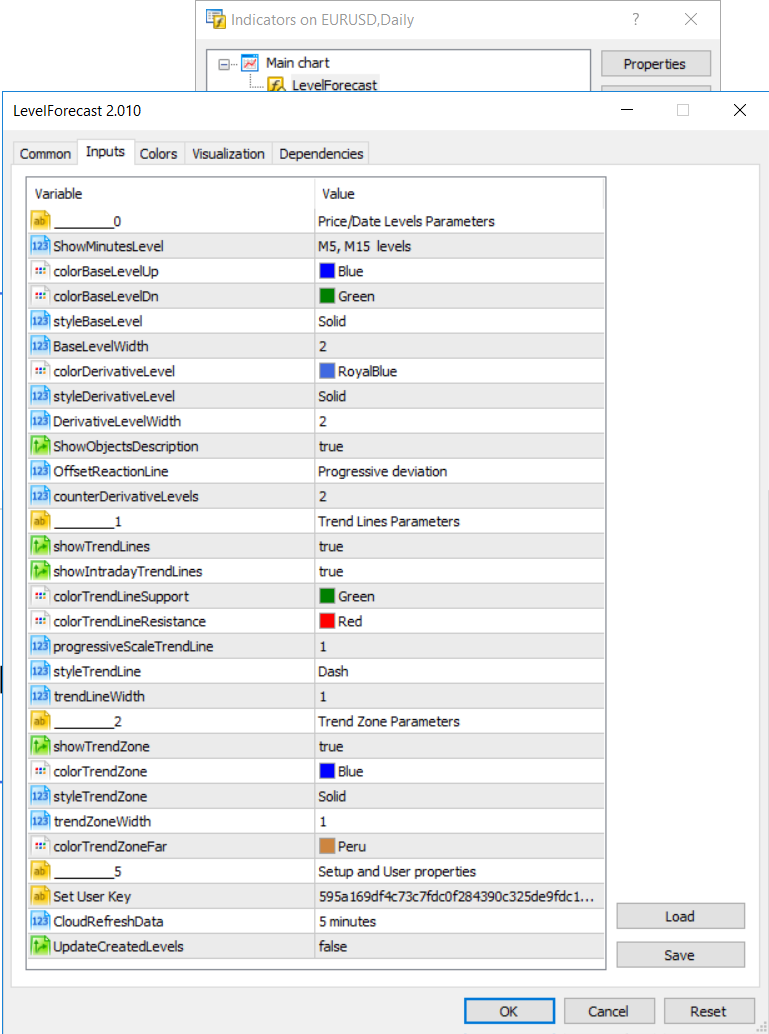
1. On the Input Parameters tab, you can change or set the required parameters for the LevelForecast indicator.
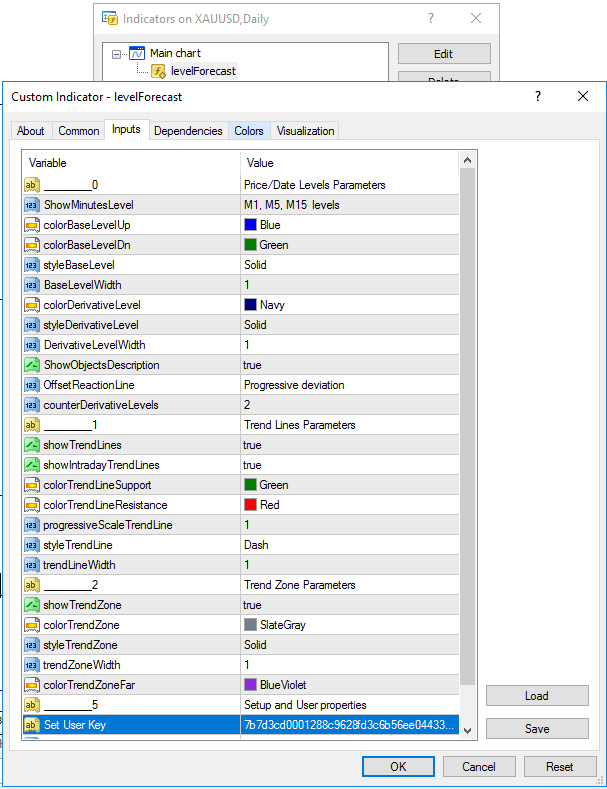
The parameters group "Price / Date Levels Parameters" includes parameters influencing the construction and display of price and time levels.
- Parameter ShowMinutesLevel - tells the indicator that it is necessary to project Derivatives Price Levels in the minute scale (M15, M05, M01) from the list.
- Derived price levels are modeled from the elder timeframes to the younger ones. Derived price levels can be combined according to your conditions.
- The colorBaseLevelUp parameter specifies the color of the Base Level of the previous extremum Up.
- The colorBaseLevelDn parameter specifies the color of the Base Level of the previous extremum Dn.
- The styleBaseLevel parameter specifies the display style of the
price and time levels. Possible options:
- Solid - Solid line
- Dash - Dashed line
- Dot - Dotted line
- DashDot - Bar-dashed line
- DashDotDot - Dashed dotted line with double dots
- The parameter BaseLevelWidth - sets the thickness of the display of price and time levels. Possible options: from 1 (thin line) to 5 (thick line)
- The colorDerivativeLevel parameter specifies the color of the Derived Level for both the price and time levels.
- The styleDerivativeLevel parameter specifies the display
style of the price and time levels. Possible options:
- Solid - Solid line
- Dash - Dashed line
- Dot - Dotted line
- DashDot - Bar-dashed line
- DashDotDot - Dashed dotted line with double dots
- Parameter DerivativeLevelWidth - specifies the thickness of the display of price and time levels.
- Possible options: from 1 (thin line) to 5 (thick line)
- Parameter ShowObjectsDescription - enables or disables visualization of level names
- The OffsetReactionLine parameter specifies the scale of the constructed price levels
- Parameter counterDerivativeLevels - sets the number of visible level models for Derived price levels on the chart.
- Parameter ShowTrendLines - enables/disables the projection of daily and weekly Support and Resistance levels on the chart.
- Parameter ShowIntradayTrendLines - enables/disables the projection of intraday models of Support and Resistance levels on the chart.
- The colorTrendLineSupport parameter specifies the color of the Support Level.
- The colorTrendLineResistance parameter specifies the color of the Resistance Level.
- The styleTrendLine parameter specifies the display style of the
Support and Resistance levels. Possible options:
- Solid - Solid line
- Dash - Dashed line
- Dot - Dotted line
- DashDot - Bar-dashed line
- DashDotDot - Dashed dotted line with double dots
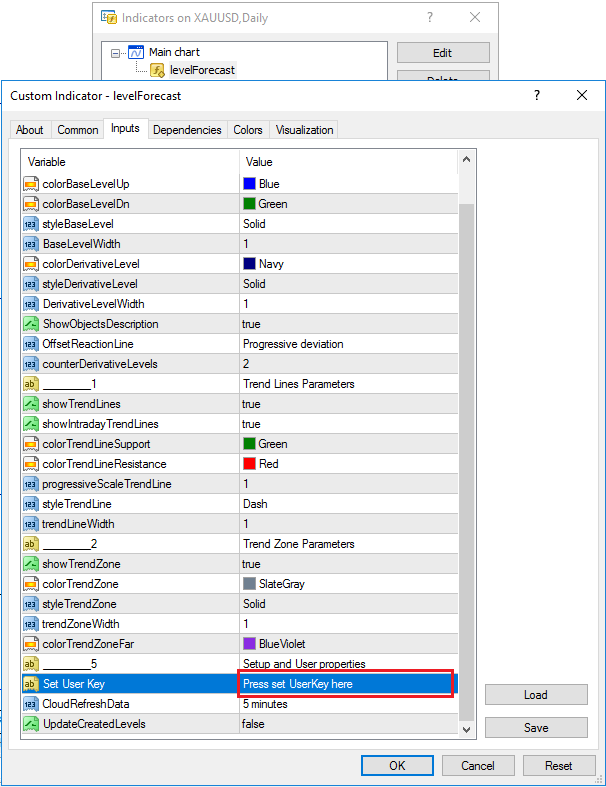
- Parameter UserKey - personal key, this is a unique hexadecimal value, it is necessary to identify your queries and build levels.
- Parameter cloudRefreshData - specifies the frequency of request to the LevelForecast cloud (5 minutes, 15 minutes, 30 minutes)
- Parameter UpdatedCreatedLevels - enables/disables additional mechanisms for redrawing the constructed models on the chart
The parameter group "Trend Lines Parameters" includes parameters influencing the construction of Support and Resistance levels.
The trendLineWidth parameter specifies the display thickness for support and resistance levels. Possible options: from 1 (thin line) to 5 (thick line).
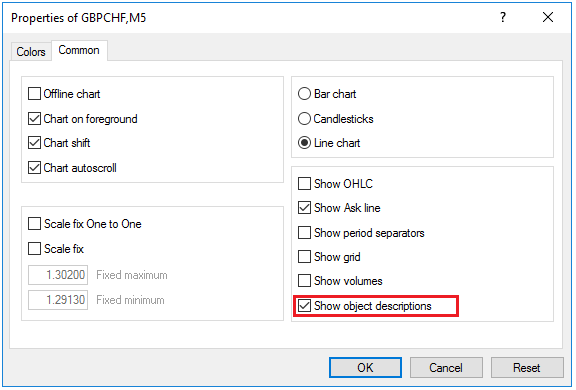
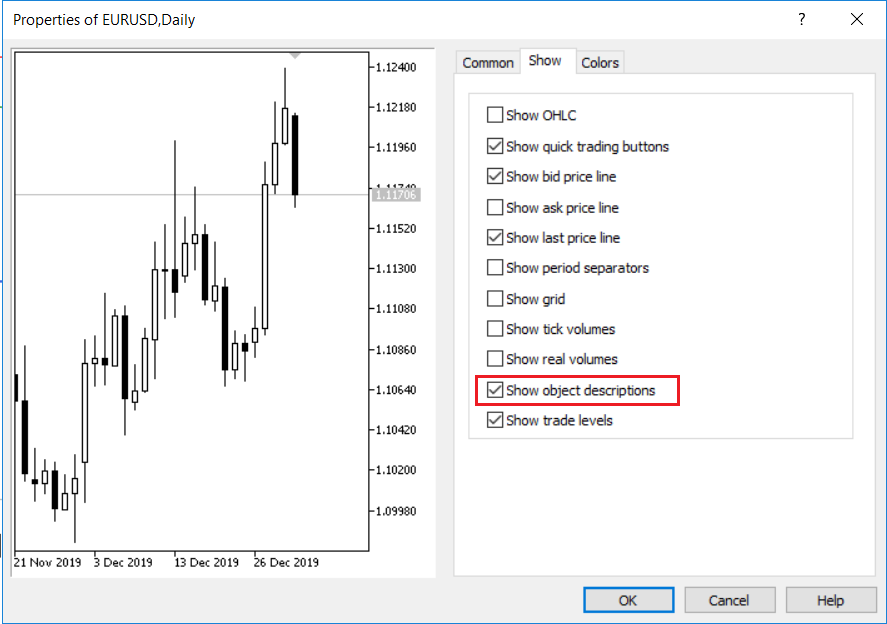
To display the abbreviations (names) of Price and Time levels, we recommend to check and activate the Show object description parameter - in the Chart window, press the F8 key or click on the tool properties, then go to tab General and activate the Show object description option.
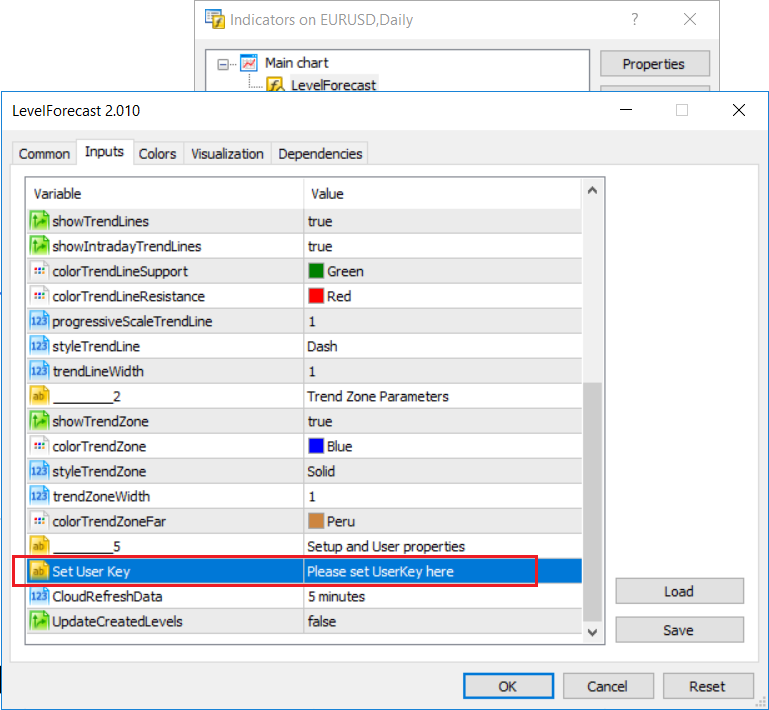
To enter or change the values for your personal key, you need: call the LevelForecast indicator Properties menu, go to the Input parameters tab and in the UserKey parameter in the field to the right, enter the actual values of your personal key.
LevelForecast is a comprehensive system of technical analysis. System LevelForecast allows you to build a model of price and time levels in the forecast range. On the created algorithms and basic principles of the LevelForecast system, a technical analysis indicator for the Metatrader5 trading platform was developed. The indicator is adapted for the desktop version of the trading platform and is developed in the MQL5 programming language.
At the heart of the modeling of Price and Time levels, algorithms are used to search for mathematical regularity and cyclicity between extremes for significant price and time intervals for the entire history of the instrument. The obtained results allow to build in the automatic mode a calculation model in the form of base and derived levels of price and time in the predicted range.
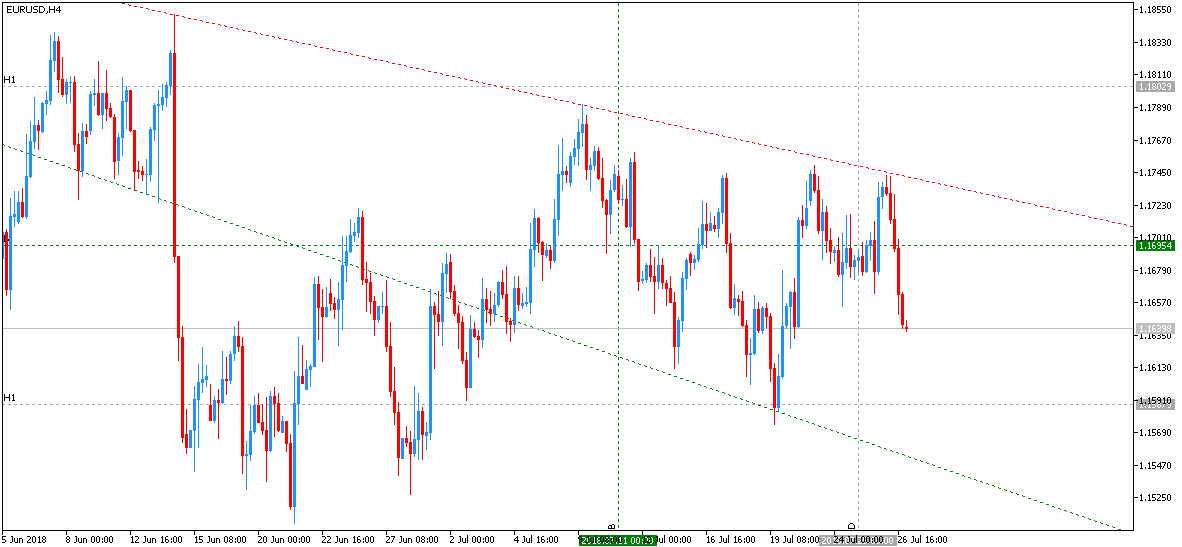
Base price levels Base Levels, on the chart are displayed by the symbol B and are constructed in the form of horizontal lines. The derivative price levels Derivatives Price Levels (D, H4, H1, M30, M15, M5, M1) are based on the constructed nearby Base price levels. The constructed levels are located on the terminal chart according to the applied price modeling algorithms. The price levels on the terminal chart are presented in a strict hierarchy, depending on the strength and significance of the levels. Naming levels can be conditionally separated in this hierarchy - from the base level B to the derived levels D, H4, H1, M30, M15, M5, M1.
Time Levels indicate a possible price reaction in a range of levels or abnormal price movements above the standard ATR value. In the chart, the time levels are displayed with the symbol B and are constructed as vertical lines. According to the applied time-level modeling algorithms, the Derivatives Time Levels (D, H4) Derived Time Levels can be presented and visualized on the chart, which have their strength and significance and are based on the constructed nearby Base time levels.
Please make sure that you have successfully downloaded the file with the indicator LevelForecast.ex5, the indicator file will often be located in the Downloads folder.
Tip: You can download the LevelForecast indicator on the LevelForecast page in the Personal Office.
1. On the main menu bar select the menu item File, then select the menu item Open the data catalog.
2. In the opened window of the directory with the data, go to the MQL5 folder
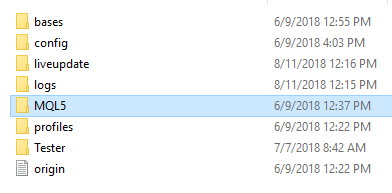
3. Next, go to the Indicators folder and copy the file with the LevelForecast.ex5 indicator, then return to the MT5 terminal.
Tip: You can create a separate folder for the LevelForecast indicator or copy the file directly to the Indicators folder.
1. On the main menu bar, select the View menu item, then select the Navigator menu item. In the appeared window of the tree structure, select the menu item Indicators and in the list of indicators we find the line with the name of the indicator LevelForecast. After that, drag the indicator onto the chart by drag-and-drop method or on the line of selecting the LevelForecast indicator, select the menu item Attach to Chart.
Note: If the indicator does not appear in the selection list in the Navigator panel, you need to do this by selecting Refresh from the Navigator panel.
2. In the window that appears, on the Input Parameters tab, you can check or change the parameters of the indicator.
3. Important: for the LevelForecast indicator to function properly, you need to check and set the DLL import settings for libraries. To do this, go to the tab "Dependencies"
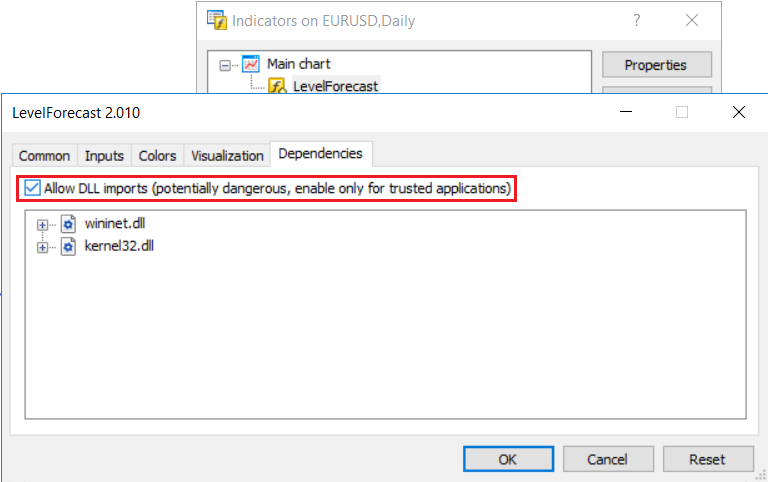
and also check the "Allow DLL import" settings in the Main menu of the "Tools" - "Settings" tab - the "Expert Advisors" tab.
1. On the Input Parameters tab, you can change or set the required parameters for the LevelForecast indicator.
The parameters group "Price / Date Levels Parameters" includes parameters influencing the construction and display of price and time levels.
- Parameter ShowMinutesLevel - tells the indicator that it is necessary to project Derivatives Price Levels in the minute scale (M15, M05, M01) from the list.
- Derived price levels are modeled from the elder timeframes to the younger ones. Derived price levels can be combined according to your conditions.
- The colorBaseLevelUp parameter specifies the color of the Base Level of the previous extremum Up.
- The colorBaseLevelDn parameter specifies the color of the Base Level of the previous extremum Dn.
- The styleBaseLevel parameter specifies the display style of the
price and time levels. Possible options:
- Solid - Solid line
- Dash - Dashed line
- Dot - Dotted line
- DashDot - Bar-dashed line
- DashDotDot - Dashed dotted line with double dots
- The parameter BaseLevelWidth - sets the thickness of the display of price and time levels. Possible options: from 1 (thin line) to 5 (thick line)
- The colorDerivativeLevel parameter specifies the color of the Derived Level for both the price and time levels.
- The styleDerivativeLevel parameter specifies the display style of
the price and time levels. Possible options:
- Solid - Solid line
- Dash - Dashed line
- Dot - Dotted line
- DashDot - Bar-dashed line
- DashDotDot - Dashed dotted line with double dots
- Parameter DerivativeLevelWidth - specifies the thickness of the display of price and time levels.
- Possible options: from 1 (thin line) to 5 (thick line)
- Parameter ShowObjectsDescription - enables or disables visualization of level names
- The OffsetReactionLine parameter specifies the scale of the constructed price levels
- Parameter counterDerivativeLevels - sets the number of visible level models for Derived price levels on the chart.
- Parameter ShowTrendLines - enables/disables the projection of daily and weekly Support and Resistance levels on the chart.
- Parameter ShowIntradayTrendLines - enables/disables the projection of intraday models of Support and Resistance levels on the chart.
- The colorTrendLineSupport parameter specifies the color of the Support Level.
- The colorTrendLineResistance parameter specifies the color of the Resistance Level.
- The styleTrendLine parameter specifies the display style of the
Support and Resistance levels. Possible options:
- Solid - Solid line
- Dash - Dashed line
- Dot - Dotted line
- DashDot - Bar-dashed line
- DashDotDot - Dashed dotted line with double dots
- Parameter UserKey - personal key, this is a unique hexadecimal value, it is necessary to identify your queries and build levels.
- Parameter cloudRefreshData - specifies the frequency of request to the LevelForecast cloud (5 minutes, 15 minutes, 30 minutes)
- Parameter UpdatedCreatedLevels - enables/disables additional mechanisms for redrawing the constructed models on the chart
The parameter group "Trend Lines Parameters" includes parameters influencing the construction of Support and Resistance levels.
The trendLineWidth parameter specifies the display thickness for support and resistance levels. Possible options: from 1 (thin line) to 5 (thick line).
To display the abbreviations (names) of price and Time levels, we recommend to check and activate the Show object description parameter - in the Chart window, press the F8 key or click on the tool properties, then go to tab General and activate the Show object description option.
To enter or change the values for your personal key, you need to: call the LevelForecast indicator Properties menu, go to the Input parameters tab and in the UserKey parameter in the field to the right, enter the actual values of your personal key
More Questions?
If you have questions or you need a halp, please send us a message. Thanks.